Interesting Tech Projects
Posts tagged weather

PCB For Raspberry Pi WH1080 Weather Station
Nov 15th
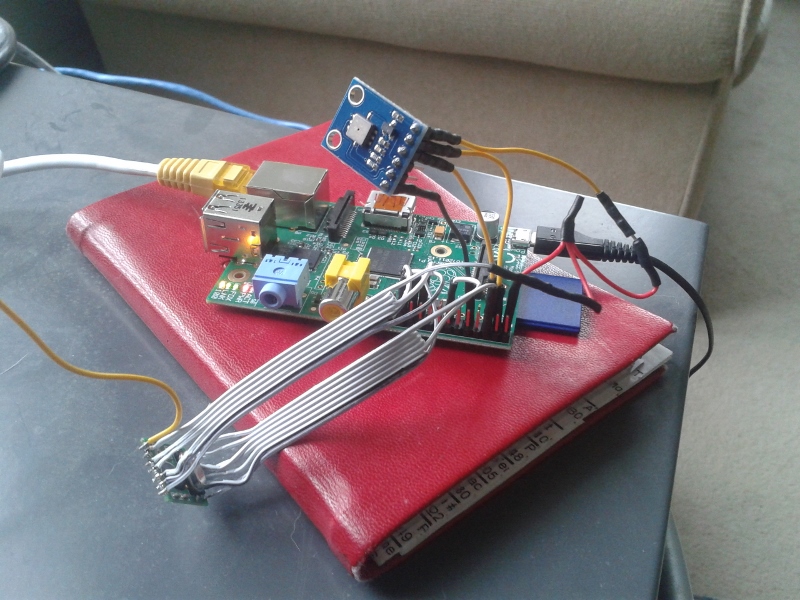
Previously I wrote about using a Raspberry Pi to receive 433MHz signals from a WH1080 weather station. This is the mess of wiring I came up with:
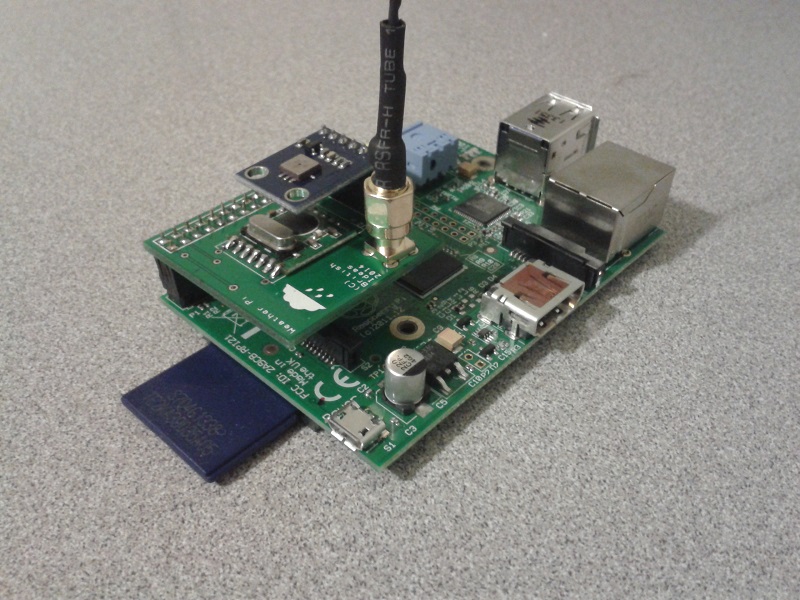
This worked fine until it stopped. I probably didn’t crimp a wire properly and too many knocks resulted in unreliable operation. To solve this I designed a PCB that connects the radio receiver, pressure sensor and an antenna to a Raspberry Pi:
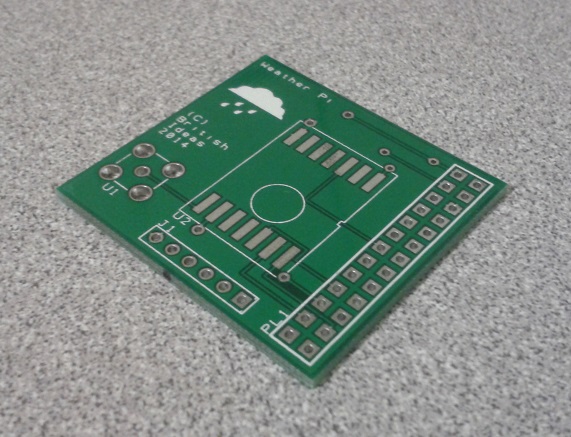
The design is very simple:
It accepts a surface-mount version of the RMF01 module (the version with a black resin blob). This is easily soldered onto the PCB by hand.
A female through-hole SMA connector is used for the antenna connection. This allows a range of off-the-shelf antennas to be used. The one I purchased from eBay didn’t work so I modified it as can be seen in the pictures. Alternatively a wire can be directly soldered to the board.
Finally a six pin BMP085 module is connected to a header. The pinout of the BMP085 module used is:
- Pin 1 = 3.3V
- Pin 2 = SDA
- Pin 3 = SCL
- Pin 4 = No connection
- Pin 5 = No connection
- Pin 6 = Ground
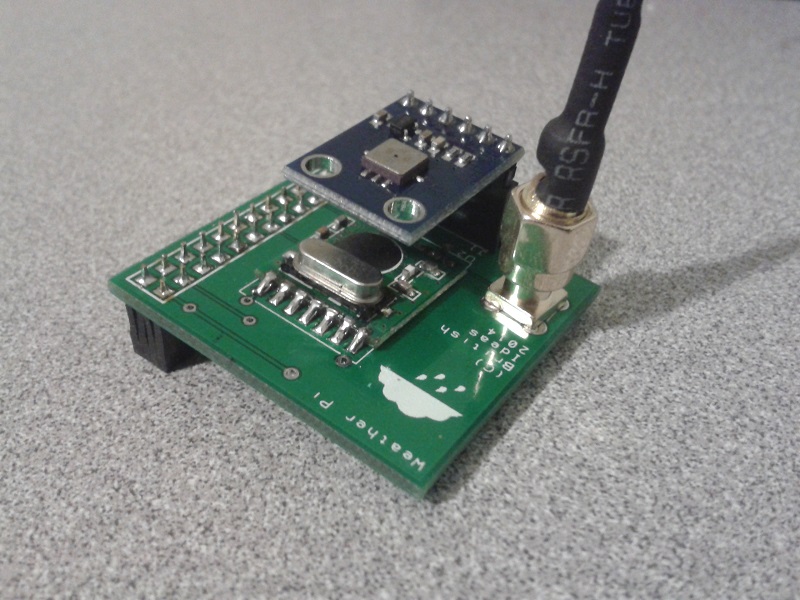
Here is how the PCB looks when populated:
Download the schematic diagram (15MB).
I have some spare boards, so if you would like one to experiment with please contact me.
Update: All the spare boards are gone. I hope everyone who received one has a lot of fun with them!
Here are the gerber files, suitable for submitting to a PCB house. The license is CC-BY-NC SA. I.e. for personal non-commercial use only. Sorry, but I am unable to provide support for these files.

WH1080 Weather Station Wind Vane
Jun 10th
I think the jury is still out on the wind vane that comes with WH1080 weather stations (e.g. Fine Offset, Mapin). Some people claim it works fine when placed high up away from any buildings, trees or other obstructions. Many people complain that it is just not reliable regardless. It doesn’t help that the weather stations come with a short pole.
From watching the vane it seems one of the issues is when the wind is gusty. I’ve noticed that when a gust ends the vane becomes destabilized and simply spins around and around.
For me it is simply not feasible to locate the vane on the chimney so I wondered if adding software filtering to my weather station code might work.
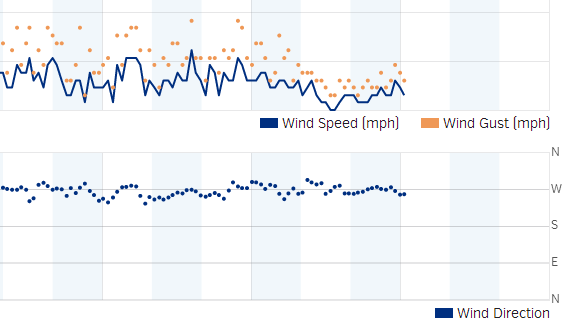
pywws already contains wind direction averaging for hourly summaries so I thought it would give that a try. Here is how the wind direction data looked a few days ago before adding averaging to the code:
 The top part shows the wind speed and gusts. The bottom shows the wind direction. As you can see it is hard to see any pattern beyond the wind coming from the south, east or north.
Here is the wind direction data today after adding the averaging:
Much better. It is clear the wind was coming out of the west. While the above data was being captured I could see the vane swinging from north to south all the time, so it is pretty nice that the averaging was able to pick out the correct wind direction.
As previously mentioned the algorithm was taken from pywws, but with a couple of changes added. It works as follows:
- When the receiver starts it collects a new wind vector every 48 seconds. The vector consists of the wind direction and average speed. This comes directly from the weather station transmitter.
- While the receiver is collecting the first 16 wind vectors it reports the current wind direction to Weather Underground. So for the first 12.8 minutes (16 x 48 seconds) after reset the wind direction is not averaged.
- Once 16 wind vectors have been collected the receiver starts averaging the wind direction and reporting the average to Weather Underground. Every 48 seconds when new data is received the oldest wind vector is overwritten. So the receiver always has the last 16 wind vectors to work with.
- The latest 16 wind vectors are converted into weighted vectors. There is one vector for each compass point direction and the size of each vector is the sum of the average wind speeds measured coming from that direction. This method ensures the result favors directions where stronger winds came from.
- Using some trigonometry the average wind direction is calculated.
- In the situation where there is no wind for all 16 wind vectors (so no wind for 12.8 minutes) then the last average wind direction is used.
The code can be obtained from github.

WH1080 Weather Station and Weather Underground
Jun 7th
A couple of years ago I bought a WH1080 weather station (e.g. Fine Offset, Mapin). It’s available under many brands from many outlets all over the world and is very common. Here are pictures of what this cheap weather station looks like:

I had the touchscreen connected to a Linux sever via USB and used pywws to upload to Weather Underground. This worked well until USB broke so I had to look for a new solution.
Kevin Sangeelee had developed some code that allowed a Raspberry Pi to receive the 433MHz radio signals and decode them. It also had support for a pressure sensor. Perfect. The code can be found here: http://www.susa.net/wordpress/2012/08/raspberry-pi-reading-wh1081-weather-sensors-using-an-rfm01-and-rfm12b/
The RFM01 was obtained from Maplin for about £4 and was trivially connected to the RPi. Kevin’s article gives the connections. Note: I didn’t use any resistors.
The BMP085 was also easily connected. Purchased from eBay for about £6 it connects directly to the I2C pins. Again, no resistors needed.
The first step was up update Kevin’s code for revision 2 of the RPi. This is required because a GPIO pin has changed and the second I2C bus is now used.
Now I ran into a stumbling block – how to get the data into pywws. I hoped that this problem had already been solved but unfortunately I would have to start writing custom python modules. After thinking about it for a while I decided that all I needed was to upload data to Weather Underground. I didn’t need the other features of pywws. Fortunately Weather Underground has a simple way of uploading using a HTTP GET request. The data just needed to be massaged into the correct format. While I was at it I decided to use the rapid-fire updating. This means that Weather Underground displays new data from your station roughly every 48 seconds – you can watch it continually update.
You can get the code from GitHub here: https://github.com/ajayre/WH1080-Weather-Underground.
Create a text file in the same folder as the executable called wunderground_creds.txt. On the first line enter the name of your weather station ID, for example IWESTYORKS30. On the second line enter your Weather Underground password.
Compile, run and follow Kevin’s instructions for setting up and tuning. Don’t forget to enable the SPI and I2C modules on the RPi. Also make sure you run:
sudo dpkg-reconfigure tzdata
to set the timezone.
Make sure the path to the credentials file in wunderground.c is set correctly. To start the program on boot I used the following in a boot script:
sudo screen -d -m /home/pi/weather/wh1080_rf
