Interesting Tech Projects
Graphing Ping Times
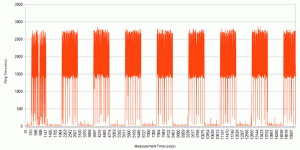
I recently had the need to generate a graph of ping times between my PC and a British Telecom server. After a quick web search the only options I found were commercial programs or free software that was incredibly bloated, complex to configure and with lots of dependencies. There must be a simpler way, and there is. Perl.
Here is my script:
#!/usr/bin/perl
# Converts ping output into a CSV file for graphing
# andy at british ideas dot com - March 29th 2011
# Public Domain
# Run using:
# ping -D 100.101.102.103 | ./pingtocsv.pl > output.csv
# or:
# cat pingdump.txt | ./pingtocsv.pl > output.csv
print "Measurement Time,Ping Time\n";
while (<STDIN>) {
  if ($_ =~ m/^\[([0-9\.]+)\].*time\=([0-9\.]+).*/i) {
    print "$1,$2\n";
  }
}
close(STDIN);
Run this using something like:
ping -D 100.101.102.103 | ./perltocsv.pl > pingtimes.csv
This will generate a CSV file. Hit Ctrl-C to terminate. Now use LibreOffice to open the CSV file and generate a graph. Here is mine (click to enlarge):
| Print article | This entry was posted by Andy on March 29, 2011 at 2:14 pm, and is filed under Linux. Follow any responses to this post through RSS 2.0. Both comments and pings are currently closed. |
Comments are closed.
